GTK Inspector
The GTK inspector is the built-in interactive debugging support in GTK.
The Inspector is extremely powerful, and allows designers and application developers to test CSS changes on-the-fly, magnify widgets to see even the smallest details, and check the structure of the UI and the properties of each object.
Enabling the GTK Inspector
To enable the GTK inspector, you can use the Control + Shift + I
or Control + Shift + D keyboard shortcuts, or set the
GTK_DEBUG=interactive environment variable.
There are a few more environment variables that can be set to influence
how the inspector renders its UI. GTK_INSPECTOR_DISPLAY and
GTK_INSPECTOR_RENDERER determine the GDK display and the GSK
renderer that the inspector is using.
In some situations, it may be inappropriate to give users access to
the GTK inspector. The keyboard shortcuts can be disabled with the
enable-inspector-keybinding key in the org.gtk.Settings.Debug
GSettings schema.
Objects
The main entry point of the Inspector is the Objects page:
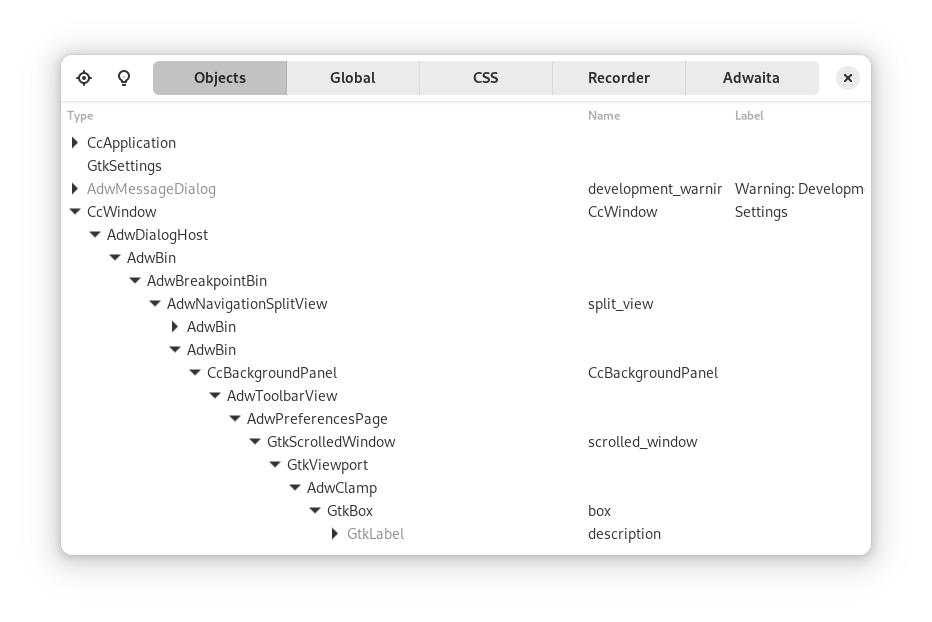
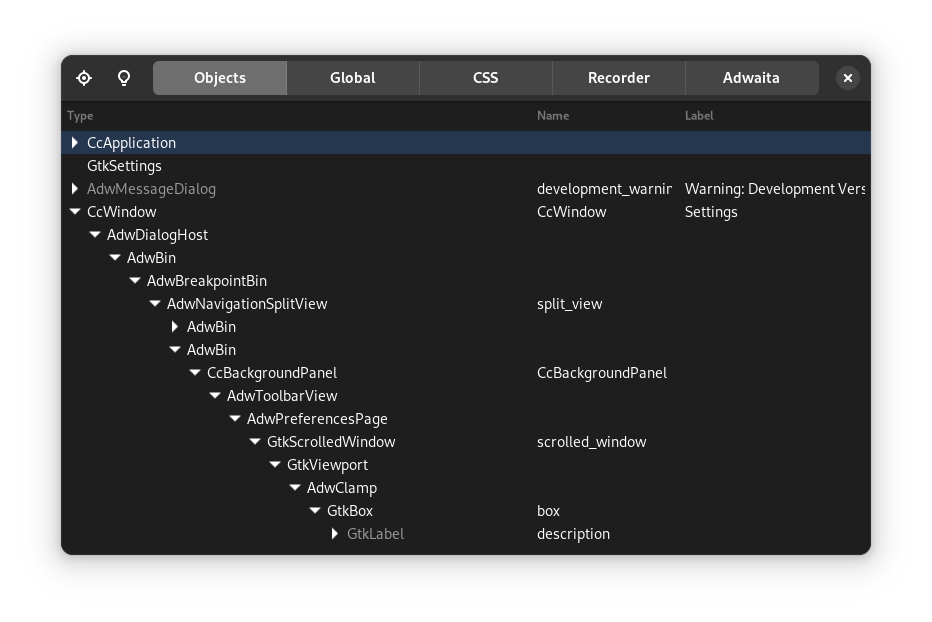
You can see the structure of the window, with each widget, its siblings and children, as well as ancillary objects like event controllers and layout managers.
Note
You can use the target icon to select a widget to inspect with your pointing device.
Once you select an object, you can inspect its type, state, builder id, reference count, geometry:
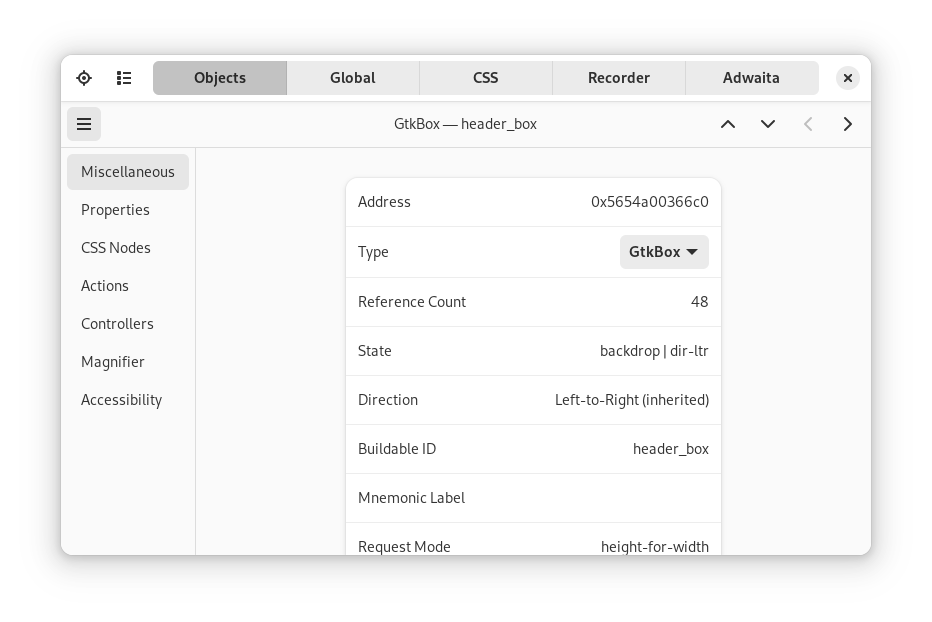
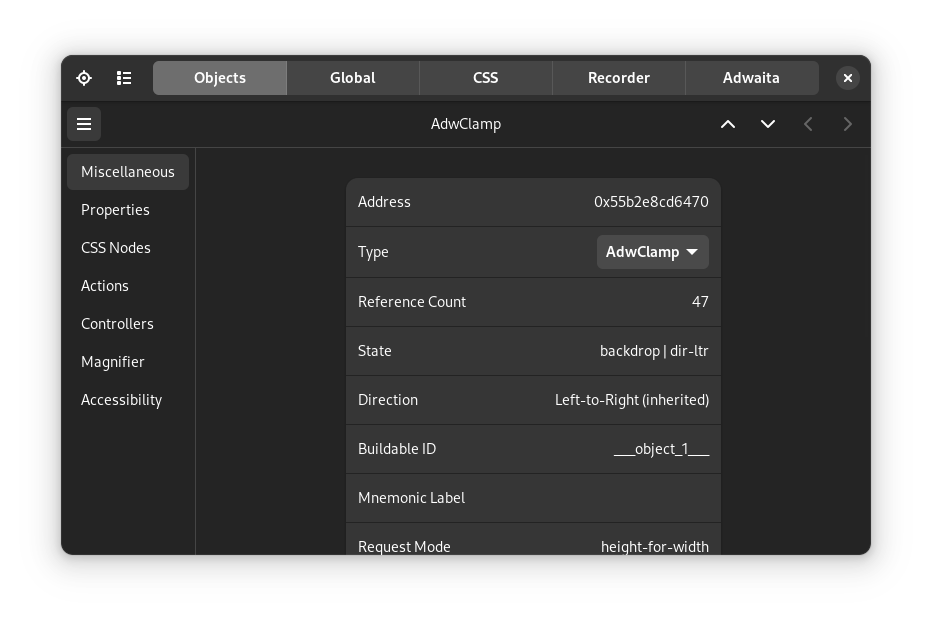
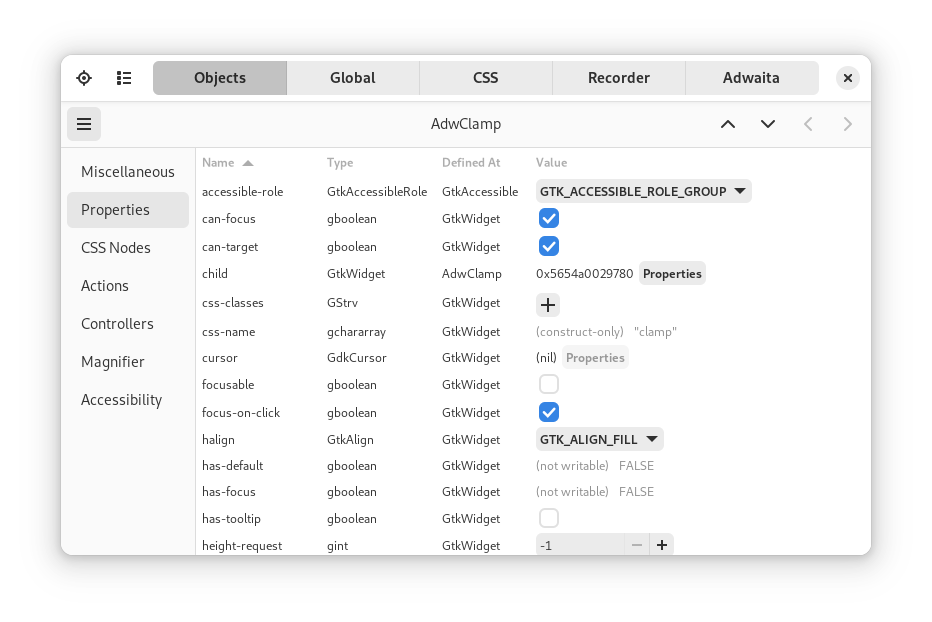
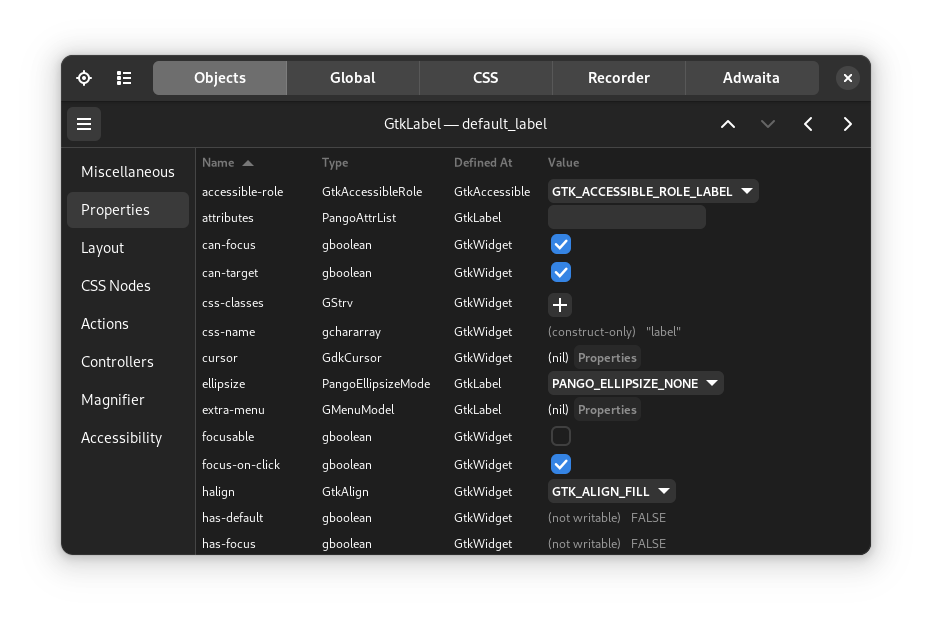
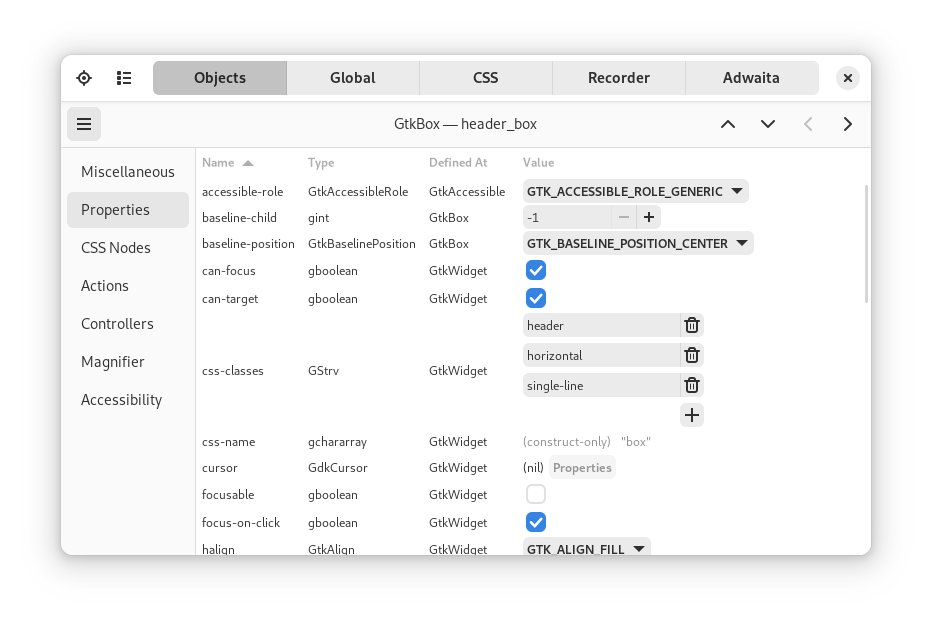
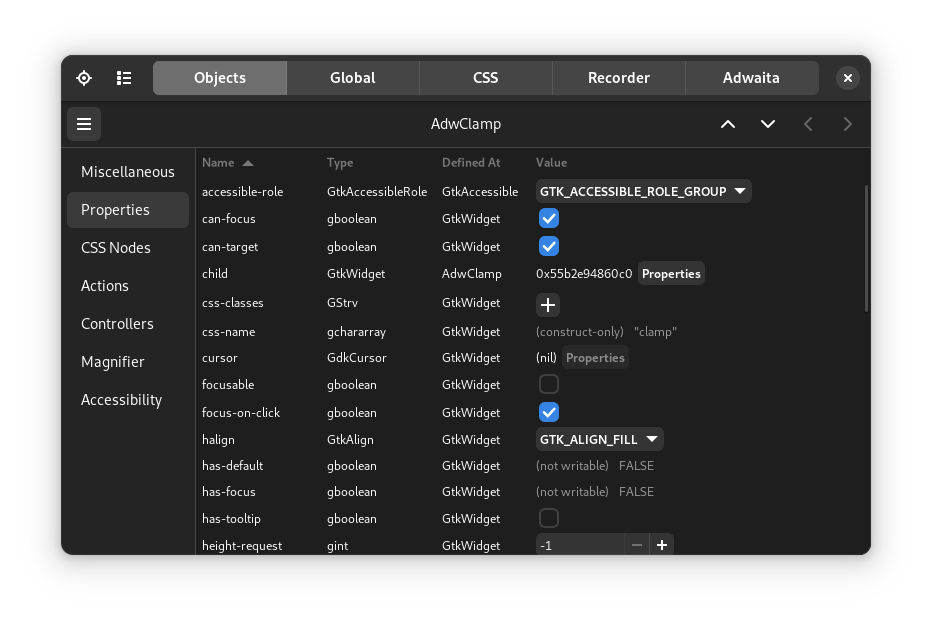
The object properties, with the ability to modify their value:
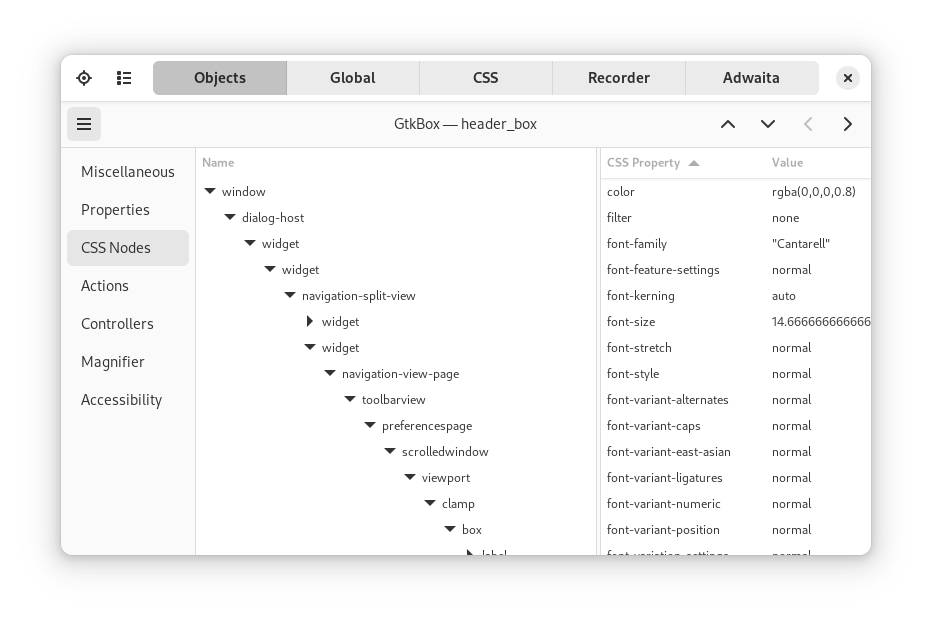
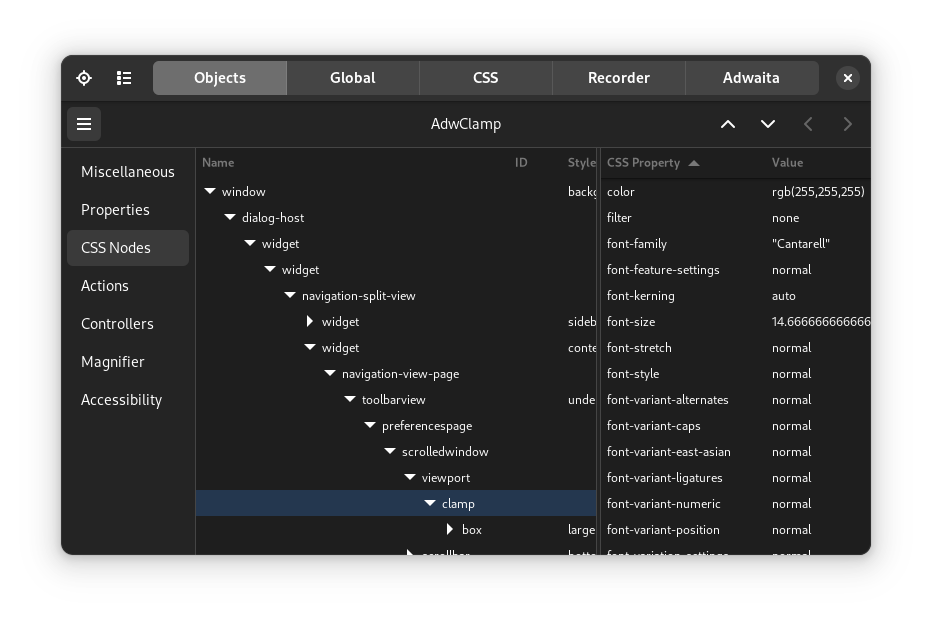
The CSS properties for a widget, including the CSS selectors hierarchy:
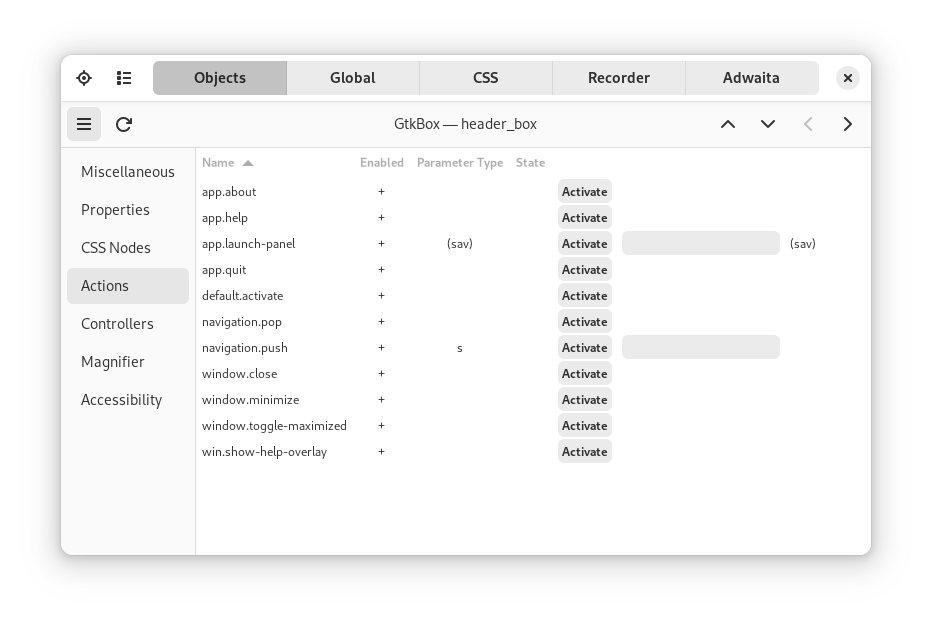
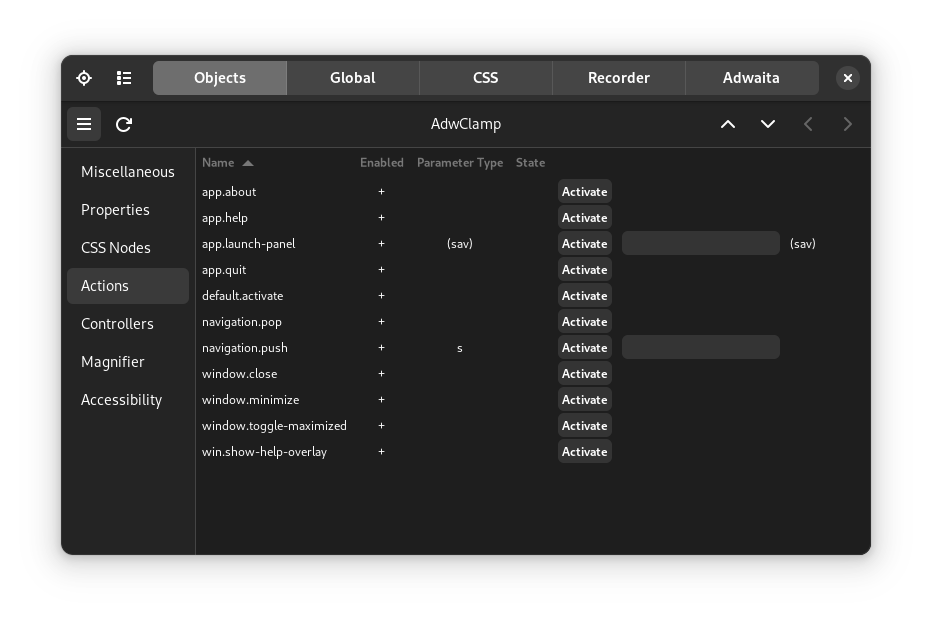
The actions installed by the object:
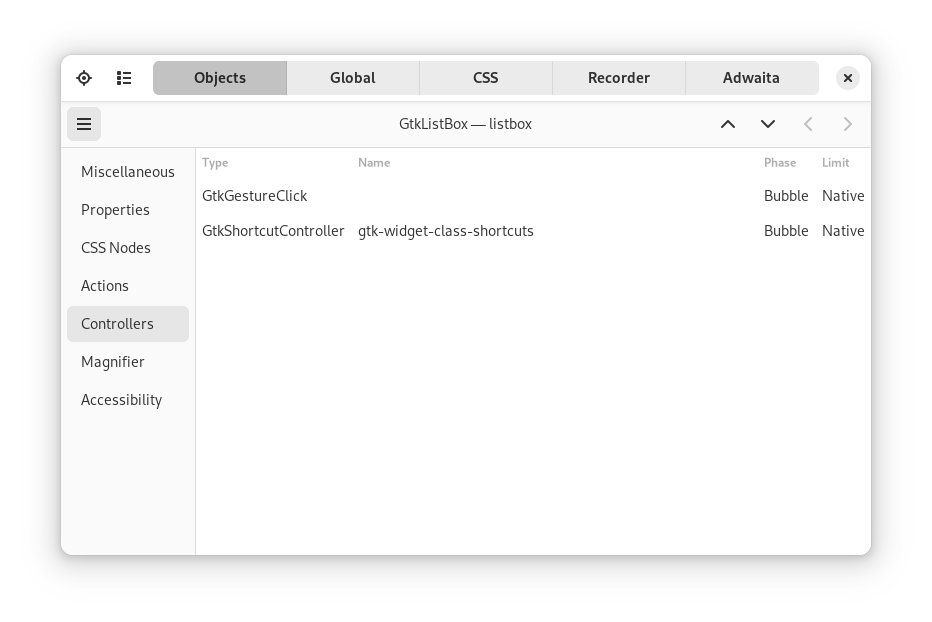
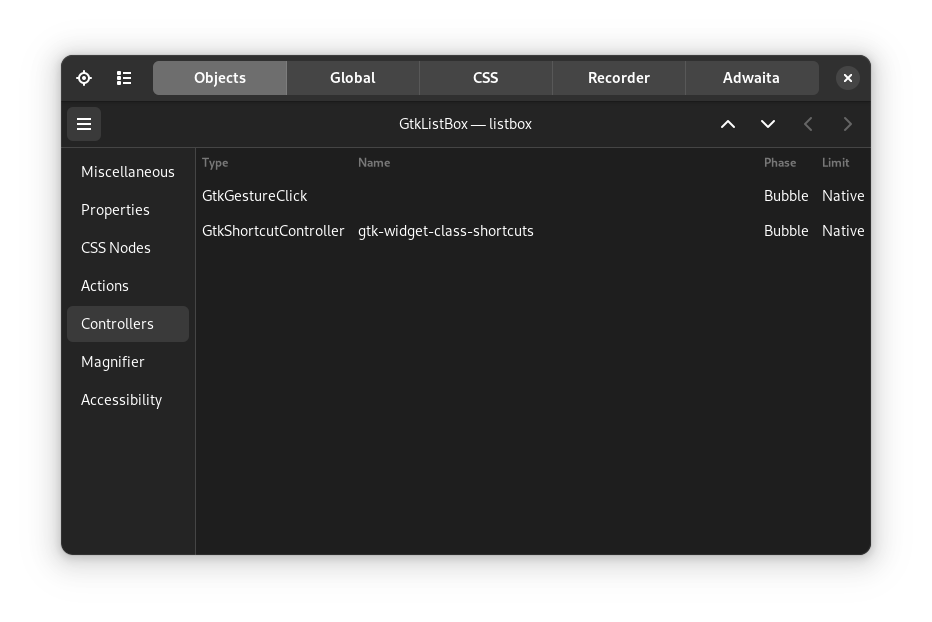
The event controllers used by the widget:
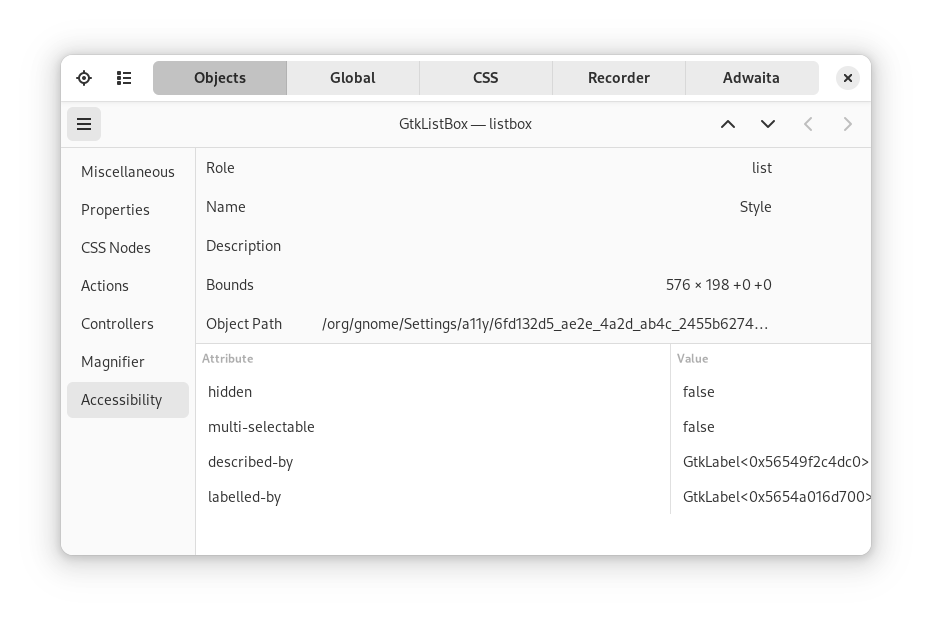
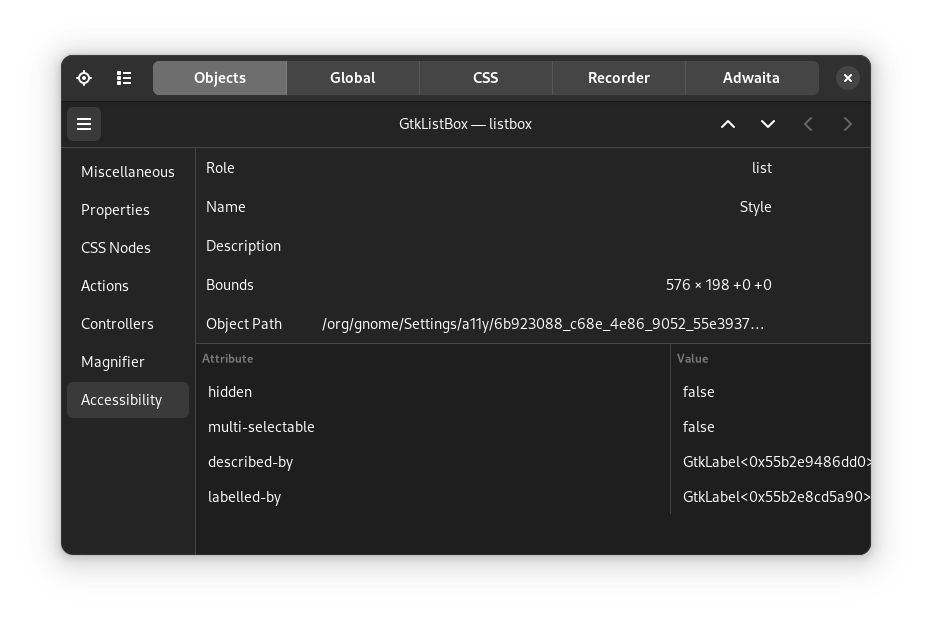
The accessibility role, attributes, and bounds:
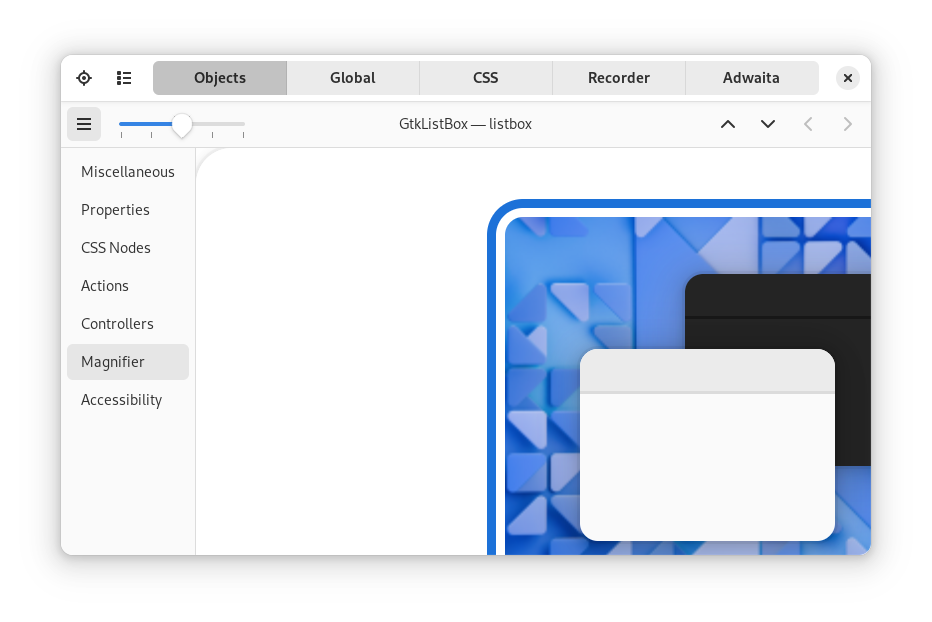
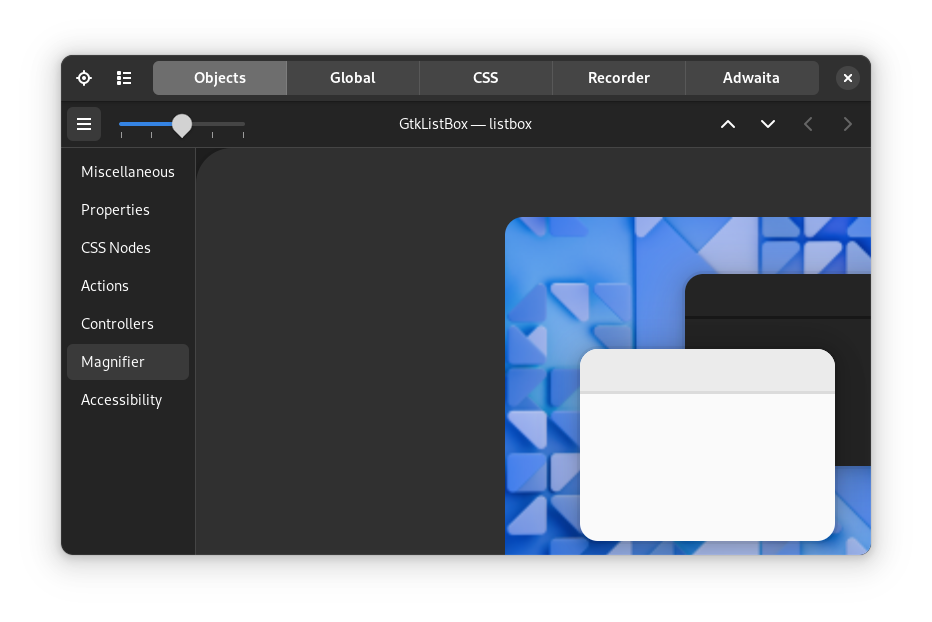
You can also zoom the widget, with different levels of magnification, as a helpful tool to ensure that the rendering is accurate:
Global
The Global page contains information related to the version and configuration of GTK:
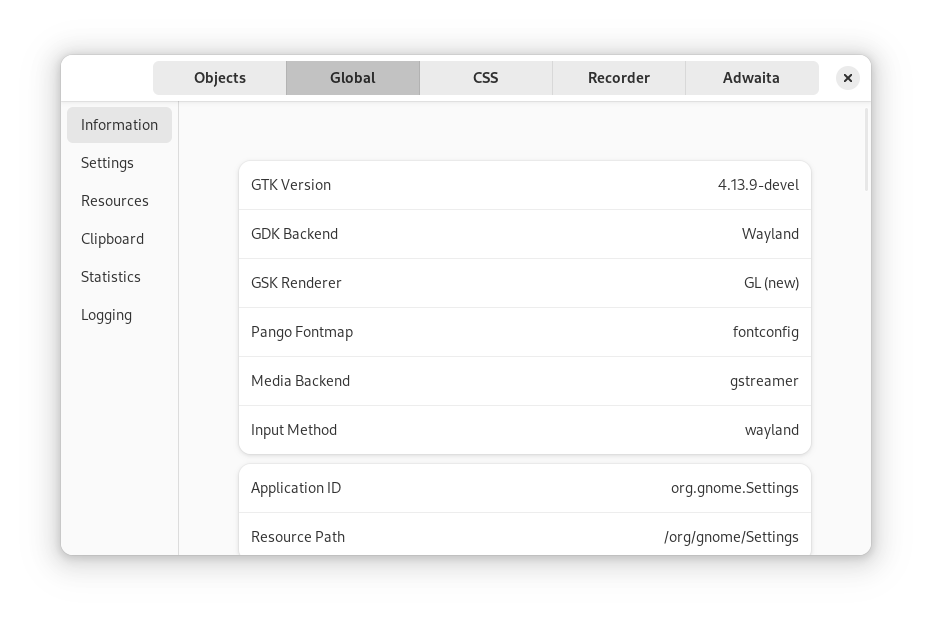
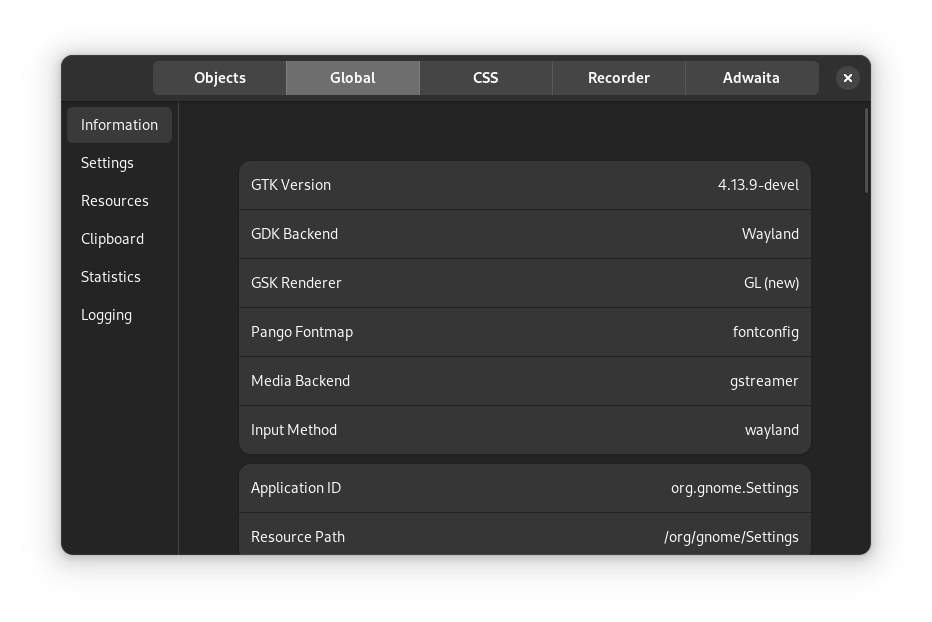
You can also find the global state of your application, like its
application ID, or the resource path for
automatically loading GResource bundles.
CSS
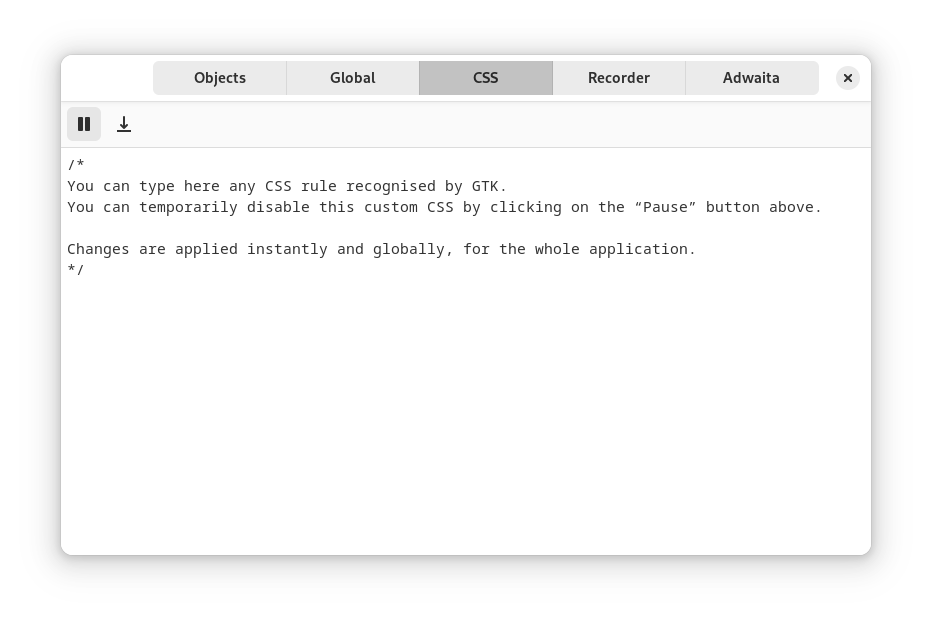
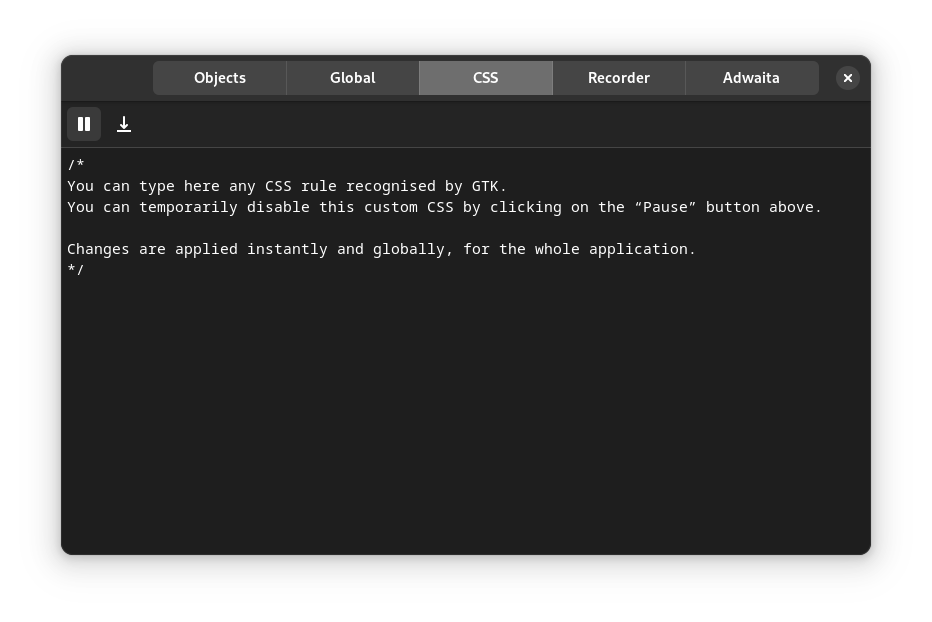
The CSS page allows you to load CSS rules, like new classes, and apply them instantenously. This page is useful for experimenting with styling and overrides.
Recorder
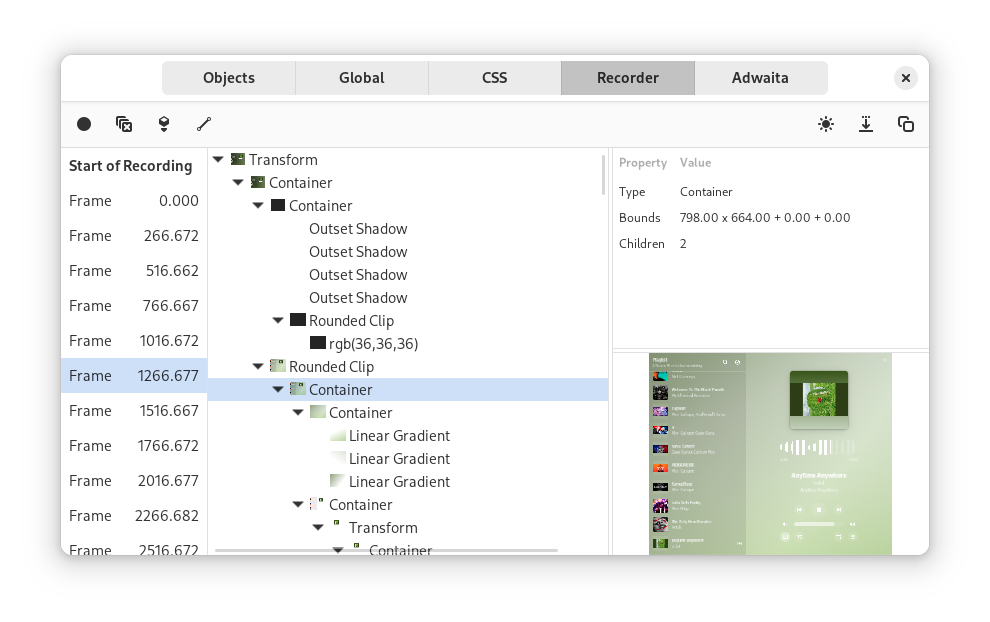
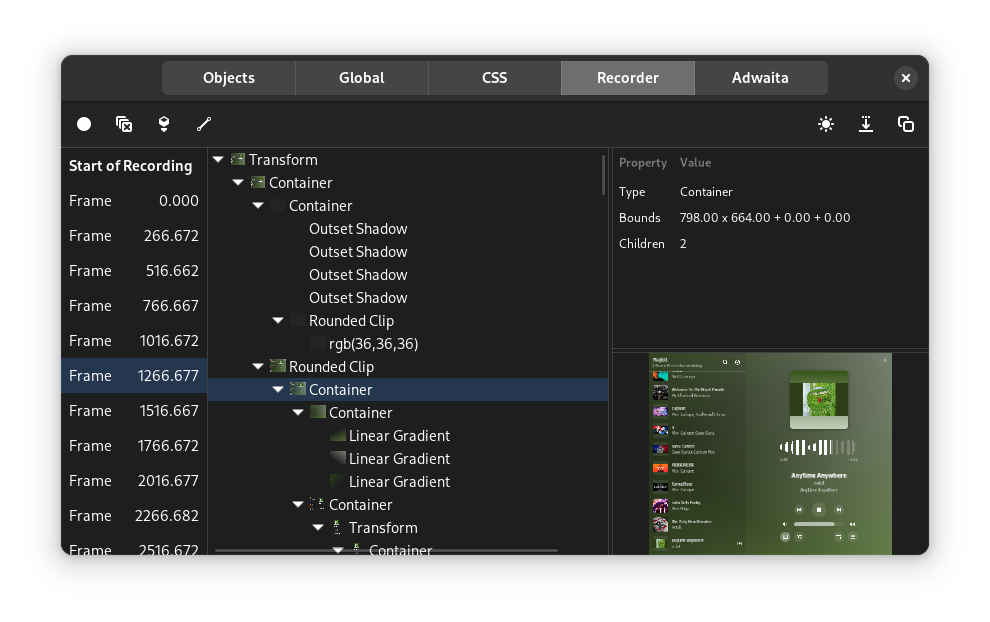
The Recorder page allows you to record the rendering pipeline of a GTK application, and inspect the render nodes, their state, and their contents:
Tip
The recording can be saved into a file, and used when reporting rendering bugs to GTK.
Extra pages
The GTK inspector is extensible through GIO extension points; applications can register their own inspector pages that GTK will add to the main inspector window.
Adwaita
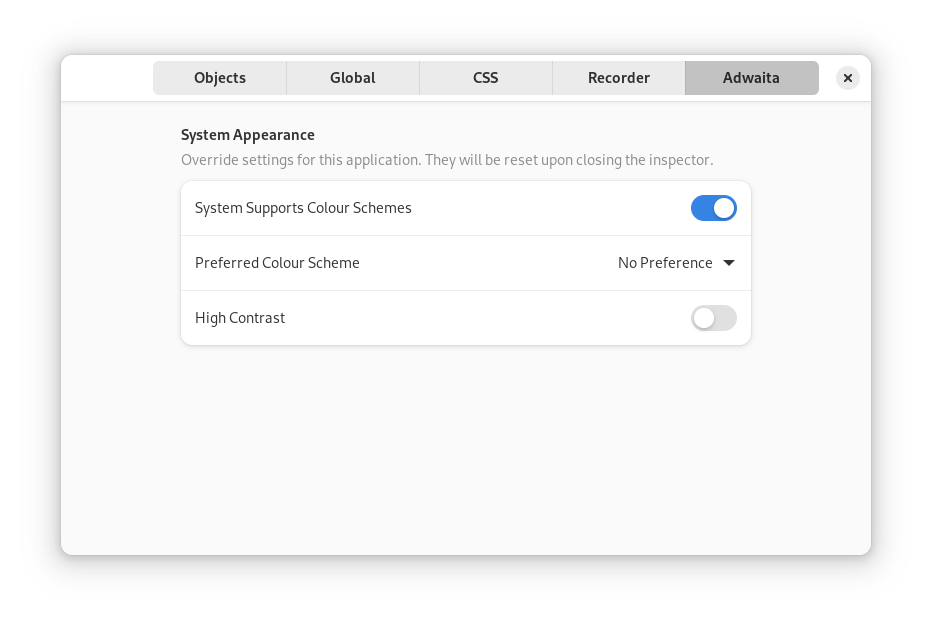
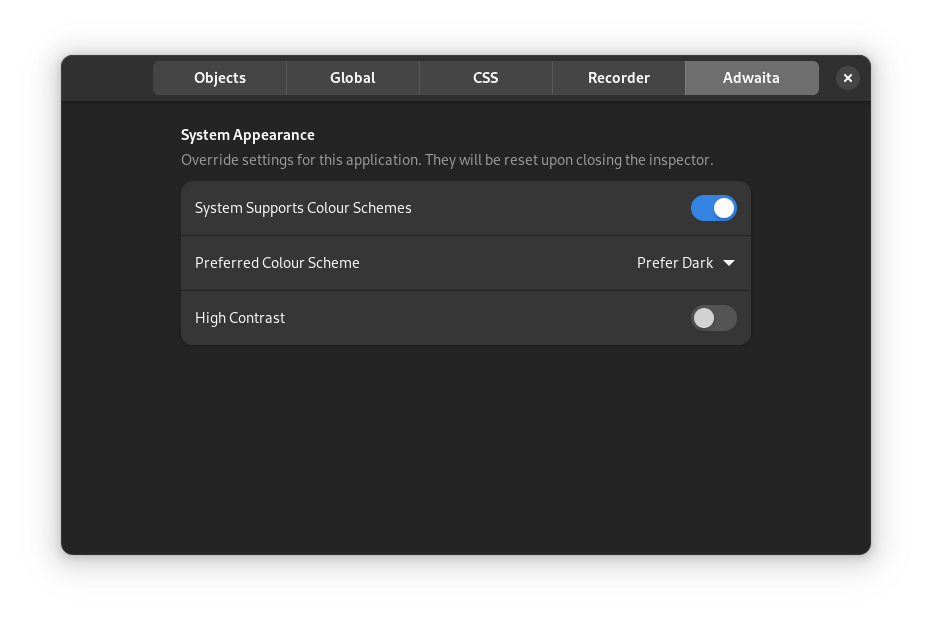
Applications using libadwaita will automatically show an Adwaita page with additional settings and controls:
